A Deep Dive Into Kubernetes Metrics - Container Resource Metrics
This time I will be looking at the metrics at the container level. These are the metrics as reported by cAdvisor.
Container Metrics from cAdvisor
The cAdvisor project from Google started as a stand-alone project for gathering resource and performance metrics from running containers on a node. In Kubernetes, the cAdvisor is embedded into the kubelet. This is the process that controls all the container on every node in the cluster. This is handy as you don’t need to run yet another process in every node to gather container metrics.
The kublet exposes all of it’s runtime metrics, and all of the cAdvisor metrics, on a /metrics endpoint in the Prometheus exposition format.
The “container” metrics that are exposed from cAdvisor are ultimately the metrics reported by the underlying Linux cgroup implementation. Just as with the node metrics, they are numerous and detailed. However, we are concerned with container use of resources provided by the underlying node. Specifically we are interested in CPU, memory, network and disk. When dealing with resources, again, its best to use the USE method when selecting the reporting on these metrics.
The USE method and Container Metrics
As a quick reminder, the USE method stands for Utilization, Saturation and Errors. Please refer to part 2 of this series for an in-depth treatment of this method.
Because the source of these metrics changes from the node (node_exporter) to the container (cAdvisor) the names of the metrics will also change. Additionally each of the metrics will be reports for all of the containers in your cluster. Using the sum method in Prometheus will be necessary to get an overall view of your application.
Before I start talking about the individual resource metrics we need to talk about a feature in Kubernetes that will make calculating saturation a bit easier. This feature is resource “requests” and “limits”.
Kubernetes Requests and Limits
At the heart of the Kubernetes system is a scheduler that places containers on nodes. Much like packing a bunch of different sized boxes with different sized items, the scheduler needs to know the capacity of the nodes and the sizes of the containers being placed on those nodes. Without knowing the “size” of the containers you can easily over-provision the nodes in your cluster causing performance problems due to overcrowding.
Requests and limits are applied to the container specification as part of a deployment. As of Kubernetes 1.10 two resources types can have requests and limits set; CPU and Memory. CPU is specified as fractions of a CPU or core (down to 1/1000th) and memory is specified in bytes.
A request is a bid for the minimum amount of that resource your container will need. A request doesn’t say how much of a resource you will be using, just how much you will need. You are telling the scheduler just how many resources your container needs to do its job. Requests are used for scheduling by the Kubernetes scheduler. For CPU requests they are also used to configure how the containers are scheduled by the Linux kernel. More on that in another post.
A limit is the very maximum amount of that resource your container will ever use. Limits must be greater than or equal to requests. If you set only limits, the request will be the same as the limit.
Limits allow the container some headroom to surge past the resource request. Limits give you one knob to over-provision containers on a node as limits are not accounted for by the Kubernetes scheduler. That being said, if your container exceeds your limits the action depends on the resource; you will be throttled if you exceed the CPU limit, and killed if you exceed the memory limit.
Running with resource requests and limits is a “Security Best Practice”:
An option of running resource-unbound containers puts your system in risk of DoS or “noisy neighbor” scenarios. To prevent and minimize those risks you should define resource quotas.
As soon as you put quotas on namespace, you will be forced to apply requests and limits to every container in that namespace.
Container CPU Utilization, Saturation, and Errors
For CPU utilization Kubernetes gives us just three metrics for each container
1.container_cpu_user_seconds_total — The total amount of “user” time (i.e. time spent not in the kernel)
2.container_cpu_system_seconds_total — The total amount of “system” time (i.e. time spent in the kernel)
3.container_cpu_usage_seconds_total — The sum of the above. Prior to Kubernetes 1.9 this is reported for every CPU in all node. That changed in 1.1.0
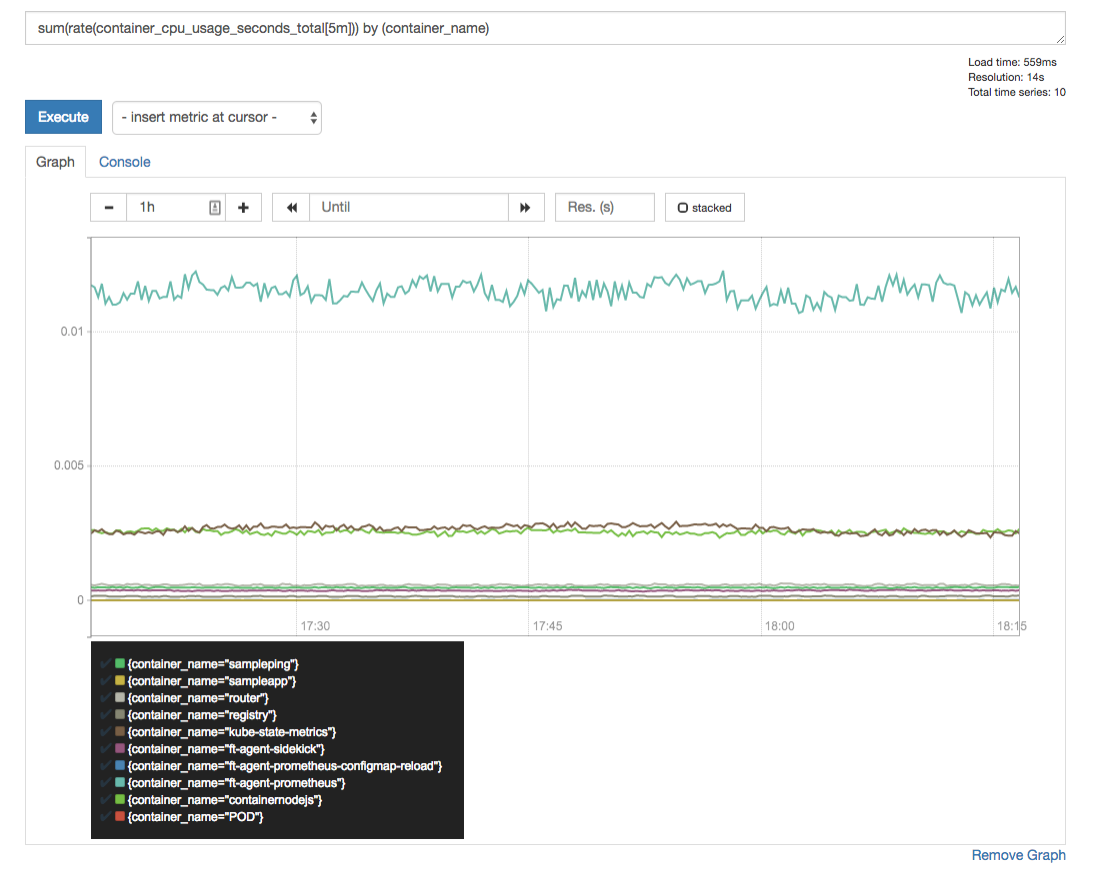
All of these metrics are counters and need to have a rate applied to them. This query will give us the number of cores that are being used by each container. For all the containers of that name across the system:
1 | sum(rate(container_cpu_usage_seconds_total[5m]))by (container_name) |
when running with CPU limits calculating saturation becomes much easier as you have defined what the upper limit of CPU usage can be. When a container exceeds its CPU limits, the Linux runtime will “throttle” the container and record the amount of time it was throttled in the series container_cpu_cfs_throttled_seconds_total. This is tracked per-container again as a counter so take a rate:
1 | sum(rate(container_cpu_cfs_throttled_seconds_total[5m])) by (container_name) |
This is an important metric to keep track of when running with CPU limits (which should always be the case!).
Much like the node_exporter, cAdvisor does not expose CPU errors.
Memory Utilization, Saturation and Errors
The memory metrics that are tracked in the cAdvisor are a subset of the 43 memory metrics exposed from the node_exporter. Here are the container memory metrics:
1 | container_memory_cache -- Number of bytes of page cache memory. |
You might think that memory utilization is easily tracked with container_memory_usage_bytes, however, this metric also includes cached (think filesystem cache) items that can be evicted under memory pressure. The better metric is container_memory_working_set_bytes as this is what the OOM killer is watching for.
To calculate container memory utilization we use:
1 | sum(container_memory_working_set_bytes{name!~"POD"}) by (name) |
In the above query, we need to exclude the container who’s name contains “POD”. This is parent cgroup for this container and will track stats for all the containers in the pod.
Container memory saturation gets easier when running with memory limits (sensing a theme here?). We will define saturation as the amount of available memory from the limit:
1 | sum(container_memory_working_set_bytes) by (container_name) / sum(label_join(kube_pod_container_resource_limits_memory_bytes, |
Here we have to join two series, one from cAdvisor and one from kube-state-metrics. Unfortunately, the container name labels don’t align, but PromQL helps with the label_join here.
memory errors are not exposed by the kubelet.
Disk Utilization, Saturation, and Errors
When dealing with disk I/O these we start with tracking all disk utilization by looking and both reads and writes. cAdvisor has series for container_fs_io_time_seconds_total and container_fs_io_time_weighted_seconds_total. These should track the similar metrics at the node level, however in my installation these are always zero.
The most basic disk I/O utilization are bytes read/written:
1 | sum(rate(container_fs_writes_bytes_total[5m])) by (container_name,device) |
Sum these to get an overall disk I/O utilization, per container.
The kubelet does not expose enough detail to have a meaningful query for container disk saturation or errors.
Network Utilization, Saturation and Errors
Network utilization at the container level you can choose between measuring in bytes or packets for both send and receive. This query is a little different in that all the network accounting happens at the Pod level, not at the container!
This query will show the network utilization for each pod, by pod name:
1 | sum(rate(container_network_receive_bytes_total[5m])) by (name) |
Again, saturation for a network is ill-defined without knowing what the max network bandwidth is. You might be able to use packets dropped as proxy:
1 | container_network_receive_packets_dropped_total |
cAdvisor also show the number of errors with the series:
1 | container_network_receive_errors_total |
Wrapping Up
The kubelet, by using cAdvisor, exposes a wealth of information about the resources for all the containers in your Kubernetes cluster. Viewing these resources through the lens of utilization, saturation and errors gives you starting point for investigation of resource constraints and capacity planning.
reference
- A Deep Dive into Kubernetes Metrics Part Zero: Introdution
- A Deep Dive into Kubernetes Metrics — Part 1 The Node Metrics
- A Deep Dive into Kubernetes Metrics - Part 2 The USE Method and node_exporter Metrics
- A Deep Dive into Kubernetes Metrics — Part 3 Container Resource Metrics
- A Deep Dive into Kubernetes Metrics — Part 4: The Kubernetes API Server
- A Deep Dive into Kubernetes Metrics — Part 5: etcd metrics
- A Deep Dive into Kubernetes Metrics — Part 6: kube-state-metrics
- How much is too much? The Linux OOMKiller and “used” memory